Tuesday 29 January 2013

Difference between Stopping and Aborting a Task in DAC


You can either stop or abort a task within a workflow from the Workflow Monitor.
Stopping a Task
  • When you stop a task the Integration service stops processing the task
  • The Integration Service does not process other tasks in the path of the stopped or aborted task.
  • When we stop a task the Integration Service continues processing concurrent tasks in the workflow.
  • If the Integration Service cannot stop the task, you can abort the task.
Aborting a Task
  • Abort task is similar to stopping but the difference is that except it has a timeout period of 60 seconds. If the Integration Service cannot finish processing and committing data within the timeout period, it kills the DTM process and terminates the session
  • When you abort a task, the Integration Service kills the process on the task(Just like the unix kill command)
When you abort a task the Integration Service continues processing concurrent tasks

Dac Process Cycle For Excuting the Workflows

DAC is used to design, execute, monitor and diagnose execution plans

Setup: Database connections, ETL setup in Informatica
Design: Define Tasks, Groups and Execution plans
Execute: Define parameters, schedule and run the execution plans
Monitor: Monitoring the run time executions
Diagnose: In case of task failure identifying the route cause and rerunning the task.

Monday 28 January 2013

Customizing Prompts ‘All Column Values’ to a Custom Value In OBIEE11g

       Customizing Prompts ‘All Column Values’ to a Custom Value:


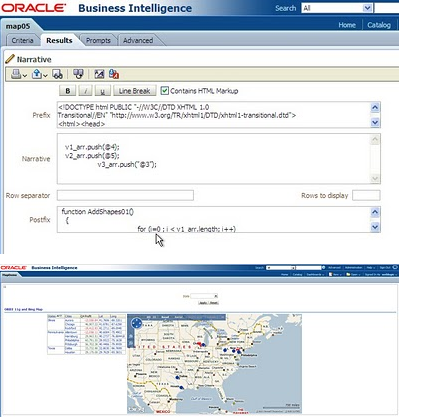
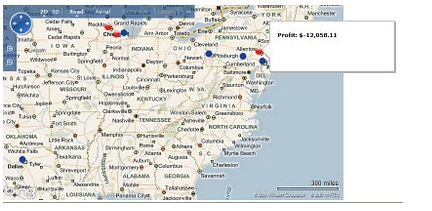
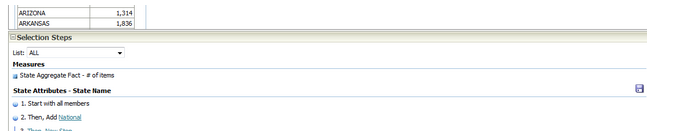
A requirement came up where the default value in an OBIEE 11 g prompt for all column values was not going to work for the client. We were building a state and national dashboard and the prompt needed to show “National” when all values of the state prompt where chosen. Now this was a relatively late arriving requirement so we did not want to go in and update all 50 plus reports from ‘is prompted’ filters to presentation variables. So we decided to utilize the groups feature introduced in 11G. The outcome looks like this:


Here are the steps to make you own custom all values, or any other subsets you are interested in.

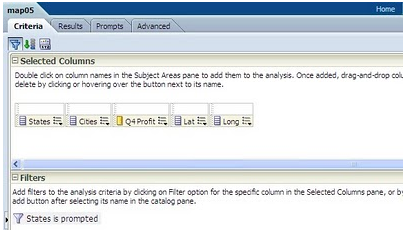
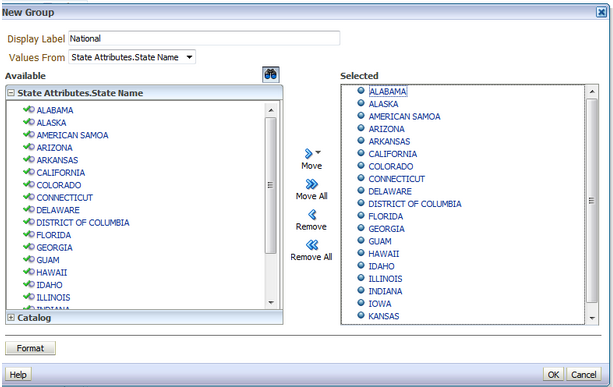
Step 1: First create a dummy report that has the column you would like to prompt on and then create a group named ‘National’ in the report.


Step 2: Provide the Display Label as ‘National’ and move all the available members (in this case US States) to the selected area as below and click OK.


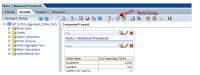
Step 3: Expand the Selection Step section and click the save icon on the column you created to group on. This will save the selection steps.


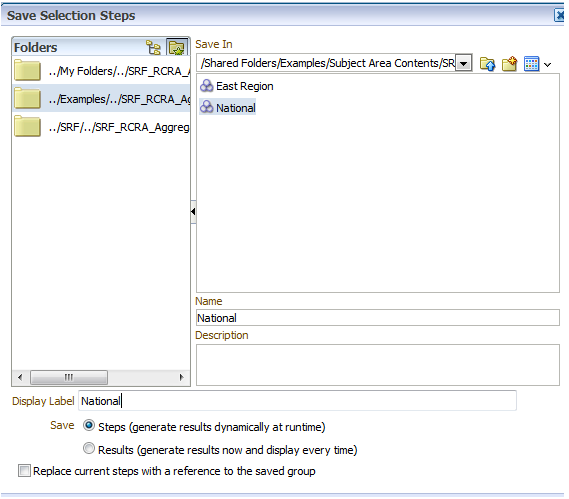
Step 4: You will want to name it the save as the label value you gave it above. Save it in the recommended folder for the dashboard group it will be used with. Decide if you want to save it statically or dynamically. In this case for all values you will want it dynamically in case new values are added later.


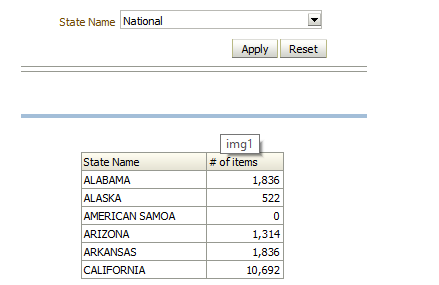
Step 5: Modify the dashboard prompt to include the new group value.
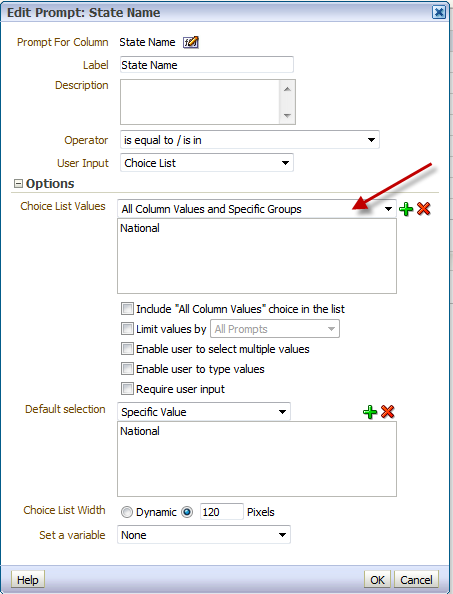
Edit the prompt and modify the Choice List Values option as ‘All Column Values and Specific Groups’ as below.


Step 6: Click on the’+’ sign to include the group value. When the popup window opens expand the Shared folder to view the available groups. It will be available in the folder of the saved report and under Subject Area Contents as in the image.


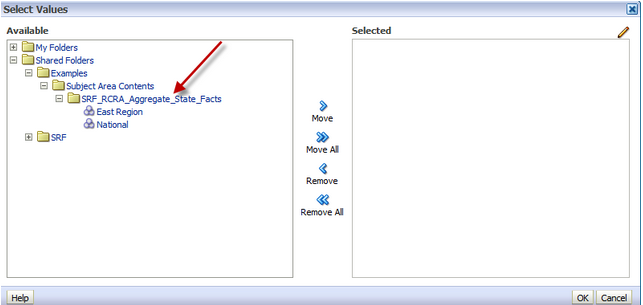
Move the National value to the selected pane on the right. Provide the default selection of the prompt as ‘National’ and save the prompt.
There you have it a customized all column values choice in your prompt that can be utilized for any number of custom groups.


OBIA 7.9.6.4 Download Links Available Here

Bing Map Integration with OBIEE 11g


As in OBIEE 10g, OBIEE 11g provides the ability to integrate Bing maps in the presentation layer through HTML and Java Script in the Narrative view. This blog demonstrate this functionality. In the example below, we will plot cities on a Bing map with conditional icons based on profit amounts (blue and red). This demo uses custom data but can be further extended to use real data sets.
Here are the steps to integrate Bing maps:
1. Create a new report that includes city, state, latitude, longitude, and the profit amount measure.


2. Format the columns Latitude and Longitude to have at least 6 decimal places to ensure precise plotting on the map.
3. Now in the Results tab, add the Narrative view to include the custom Java Script shown below. In the Prefix section call the Bing map API and declare the required variables. In our case we used arrays to hold the latitude, longitude and profit.

4. In the Narrative section, pass the required columns with @{column_location} with Latitude and Longitude. In our example we have passed Latitude (@4), Longitude (@5) and Profit (@3).
v_lat.push(@4);
v_long.push(@5);
v_profit.push(“@3″); // The added “$” makes profit a string value.
5. Define the following two functions in the Postfix section:
GetMap(): Sets the default settings for the map (like 2D mode), initial location (init_x1), default view to Road, and map zoom size to 4.
AddShapes01(): Loops through the array length and drops the push pin icons (custom icons) for each latitude and longitude, and their respective title.

 6. Check the “Contains HTML Markup” in the Narrative.The image below shows the table view and the Narrative View in the dashboard.
 

There could be couple of reasons for not showing in Compound View:
1. Use IE if you are working with Firefox or other browsers.
2. If you have made any changes in the code like the icon location make sure they are referring the correct path. Other than location try using the same code as posted.
3. Finally, set Harden XSS property to false in instanceconfig.xml file.