Wednesday 27 March 2013

OBIEE11g-Session Timeout

The connection between the OracleBI Presentation Server and OracleBI Services when idle(no requests running) will expire by default in 210 minutes.
This can be manually configured using the following step

1. Find the file instanceconfig.xml in following location

OracleInstance\Config\OracleBIPresentationServices\Coreappication\instanceconfig.xml

2. Add the following line in the security block add "ClientSessionExpireMinutes" block with no of minutes you want.

<clientsessionexpireminutes> 1440 </clientsessionexpireminutes>

3. Restart services OracleBI Presentation Services.
 

Thursday 14 March 2013

OBIEE11g - Trellis View

Hi All,
First off, the headline new feature in terms of visualisations is Trellis Charts; these are “grids of charts” that display matrices of measures with each cell in the matrix containing a micro chart, showing for example sales in each territory and product category graphed over time. Trellis Charts are available for all installations of OBIEE 11.1.1.6.2 BP1, not just Exalytics-enabled ones, but as we’ll see in a moment they’re best suited to Exalytics environments. Simple Trellis Charts, as shown in the screenshot below, allow you to select a particular graph type for each trellis chart cell, with in the example below each cell in the trellis showing sales broken-down by product category.

Find Bellow steps:
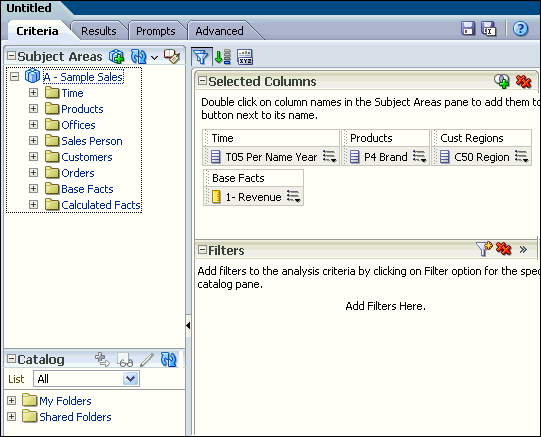
1.Create a new analysis by selecting New>Analysis on the global header, and then selecting A-Sample Sales as the subject area.
2.Select Column from criteria tab.
Screenshot for Step
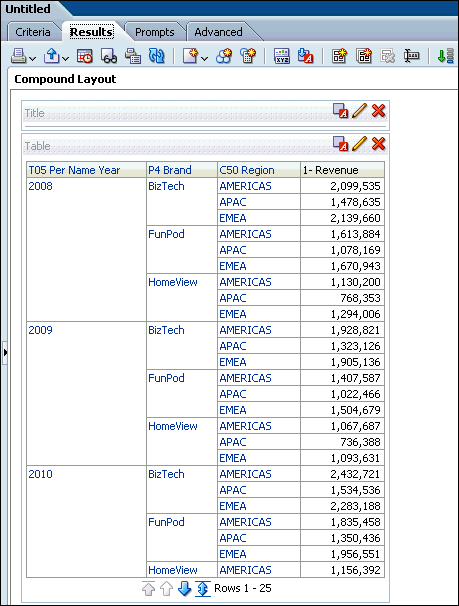
3.Click the Results tab. Two views Title and Table appear.
Screenshot for Step
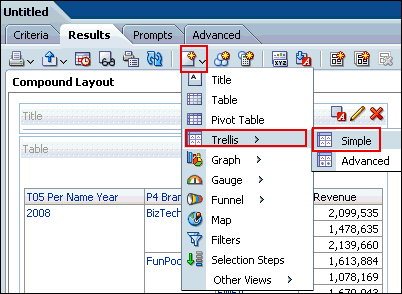
4. Add the Trellis view. Select New View>Trellis>Simple.
Screenshot for Step
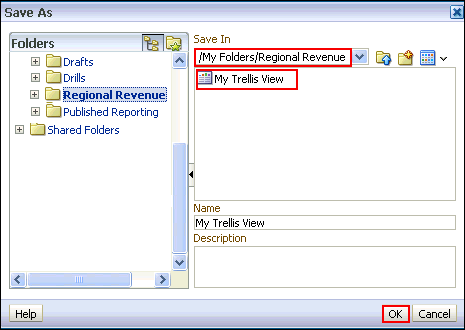
5. Save the analysis as My Trellis View, under the folder My Folders/Regional Revenue.
Screenshot for Step
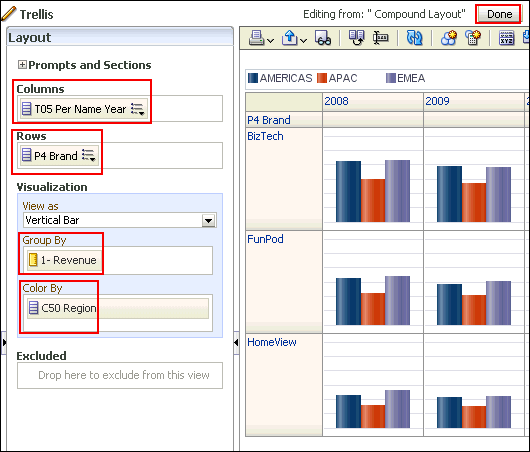
6.Click the Edit View pencil icon Screenshot for Step in the Trellis view at the Compound Layout. Note that the layout pane appears vertical.
Screenshot for Step
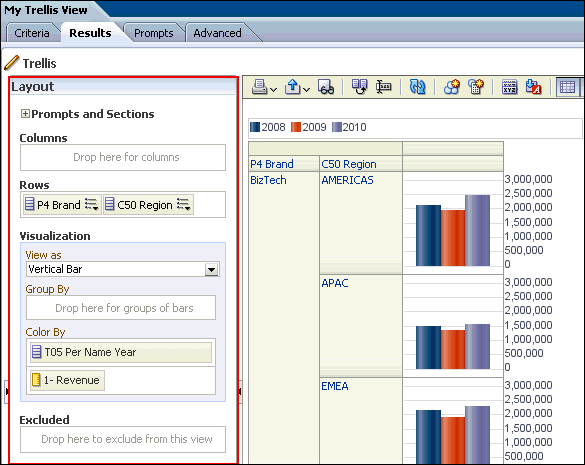
7.Arrange the dimensions and measure as shown below:
Screenshot for Step
8.Click Done.
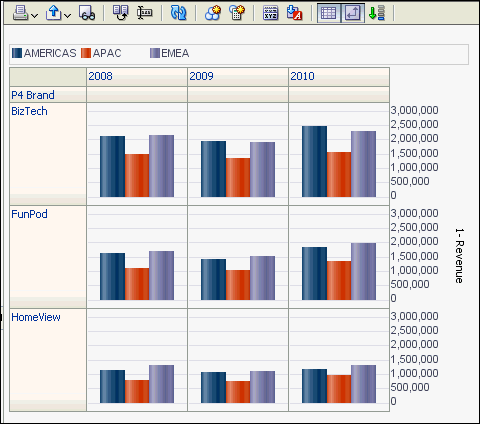
9.The Trellis view appears. Save the analysis. Observe that the measure has the same scale for all the Brands.
Finally See the result..


Screenshot for Step


Thanks,

Monday 11 March 2013

Scheduler Services Error In OBIEE11g.

Error Details:[nQSError: 17001] Oracle Error code: 28001, message: ORA-28001: the password has expired
 at OCI call OCISessionBegin.

Cause:
MDS and BIPlatform Schema password is expired.

Solution:
Change the passwords using EM. Please find below url.
http://www.artofbi.com/index.php/2011/03/mds-or-biplatform-schema-password-change-considerations/

Friday 8 March 2013

Differnce between Informatica & DAC sheduleing

1. DAC allows you to execute based on a "functional" subject area/module. This allows you to run a load for a functional module. INFA scheduler does not have this.

2. There is parallelism logic pre built based on the ETL stages, tasks, etc. You will have to manually set this up in INFA scheduler which is a pain.

3. DAC has pre built functionality to add/drop indexes/run stats, etc. INFA scheduler you will have to manually set this up. For example, suppose multiple tasks load the same table, the DAC will automatically add indexes after the last load. Dac can also differentiate ETL versus Query indexes.

4. DAC has pre built logic for FULL/INCREMENTAL loads via refresh dates. You can do this in INFA but again. It’s more work than is needed.

5. DAC allows you to configure key parameters for BI Apps loads. It dynamically uses a set of parameter files during run time to pass key values based on OBIA configuration.

6. In general, if you plan to use OBIA, using DAC will save you a lot of time and effort. Perhaps for custom INFA ETls, you can use INFA scheduler. For complex pre built loads for OBIA, it makes more sense to use DAC.

7. Suppose OBIA has a patch or new set of mappings or if you upgrade, Oracle will provide the DAC metadata whereas using INFA Scheduler you are on your own for any updates or variations in ETL load processes.

8. DAC orders the many of the Informatica task and issues command to run one by one.

9. When there are more then 300+ tasks (typically for any one module of BI APPS) it is impossible to control the tasks flow and order of execution by Informatica scheduler.

10. Also when there are many conformed dimension like one example (Organizations table is getting loaded in HR, SCM, FIN etc.) and controlling incremental and full load for conformed dimension done by DAC.

11. If you are using Informatica scheduler for your own custom grown applications you need not to use DAC for this. If you are using Custom ETL tasks along with BI APPS then I would say DAC comes handy.
Thanks..
 

Improve Report Performance in OBIEE

Hi All,

We I'll assume that you would be using some data warehouse (DWH) environment for the reports, rather than an OLTP.

1. Now in normal circumstances, Bitmap indexes are best suited for DWH because there is huge data to handle, along with ad hoc queries and more importantly, change in data (transactions) is slow.
2. Bitmap consumes very little space too as compared to the common b-tree index. And with tables containing huge amount of data, this becomes an important aspect.
3. A common assumption also says that bitmap works best with columns having lesser distinct values or cardinality. But it is best to look for the amount of data updated from concurrent systems. If that's low, always use bitmap. 

                                   But remember that we talk about indexes when we mean performance tuning of the database or DWH.

 In your case, probably you are looking to run a few reports faster which are taking some annoying time to open. So the best suggestion for you would be to place a proper cache mechanism. There are various ways in which you can manage the cache for your reports to run faster. You can easily find the methods on Google.


Other best practices may include:

1. Using star schema model wherever possible.
Snow-flaking affects performance. So if you can convert a snow flake to star by using some alias tables or multiple LTS go for it.

2. Using aggregate tables wherever possible.

3. Avoiding excessive use of functions like cast nvl, lpad, rpad, trim etc. or push them to the ETL phase.
4. Functions may kill the indexes and remember that every foreign key of your tables would also be playing as an index in the star or snowflake schema.

5. Avoiding unnecessary calculations or again push them to the ETL phase if possible. Get a proper DWH built by the ETL team, in accordance to the reporting requirements.

6. Using filter functions instead of case when statements.
Filter functions include an internal where clause which helps them to pick lesser data for comparison and hence perform better.

7. Using Union All instead of Union wherever possible.

8. Using materialized views when some complex queries are needed.

9. Some of the NQSConfig.ini parameters may also be altered for a better tuning.

And always check the NQQuery.log file to see the final query that is being executed for a report. That may also tell you what alterations might be needed for a better performance.


One thing I would like to bring to your attention is using the inside-Oracle-DB-OLAP engine to create cubes, if the source data is in an Oracle database.

Starting with 11.1.1.5 version, obiee now understands olap metadata. There is very minimal RPD work and all the aggregations and calculations are stored in database. So the benefits are:

(1). Greatly simplified aggregation strategy. One olap cube can replace dozens or even hundreds of relational MVs and aggregation tables.

(2). Complex calculated measures can be created very easily in olap cubes, using new Analytical syntax. These calculations automatically works at all levels of all dimensions. All types of Financial, statistical and time-series calculations are very simple to create.

(3). OBIEE generated queries are very simple SELECT...FROM...WHERE kind of queries. No long, multipage complicated sql queries.

(4). Cube loading is very quick due to new enhanced cube-compression features of 11.2.0.2 version of Oracle database.

(5). extremely fast query performance, compared to querying from relational tables or MVs.

(6). All types of hierarchies (parent-child, ragged, skip-level etc.) can be handled easily. No need for any kind of hierarchy changes for obiee.

(7). No new hardware or software or DBA required.

(8). only relational skills required.

So the keywords are SIMPLICITY and EASE when using OBIEE with Oracle-OLAP cubes. The power of new OLAP engine (with new 11.2.0.2 db features) is amazing. I am surprised that not many OBIEE consultants have started harnessing the power and simplicity of Oracle inside-DB olap engine.

Thanks,
Tuesday 5 March 2013

How To change mm/dd/yyyy format to mon/dd/yyyy in OBIEE11g

Hi All,

Scenario: In The DWH level data like this 01/22/2012 but in report level we display data like jan/22/2012.

Solution: we use Evaluate function to overcome to this type of situations.

EVALUATE('TO_CHAR(%1,%2)' AS CHARACTER ( 30 ), EVALUATE('TO_DATE(%1,%2)' AS DATE ,EVALUATE('TO_CHAR(%1,%2)' AS CHARACTER ( 30 ) ,"Time"."Date",'MM/DD/YYYY'),'MM/DD/YYYY'),'MON/DD/YYYY')

Here "Time"."Date" is Data column.