Analyzing Sales for “N Years Top-10 Sales Reps” Over N Years
I will Discuss on the scenario like this
Present year is 2010 We Want display the Topn 10 Sales Every Year.Like 2010,2009 and 2008 also.
The below steps should be followed to achieve this.
1. Open the http://localhost:9704/analytics webpage and login.
2. Select the Home -> Analysis -> Sample Sales links to start creating a new analysis.
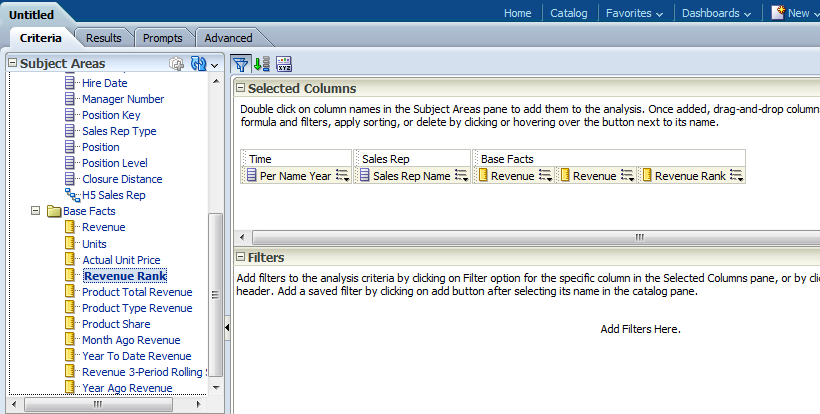
3. Select the five columns “Per Name Year”, “Sales Rep Name”, Revenue, Revenue, Revenue Rank as shown below:
4. Select the options for the “Per Name Year” Column then select Sort -> “Sort Descending” option.
5. Select the fourth Revenue column options then “Edit formula”.
6. In the “Edit Column Formula” window click the “f(…)” button to open the “Insert Function” window.
7. Select the Functions -> Aggregate -> TopN function and click OK button
8. Then click on the “Variable” button to open the “Insert Variable” window.
9. Enter “RepCount” for the “Variable Expression” and 10 for the “Default Value”, then click the OK button.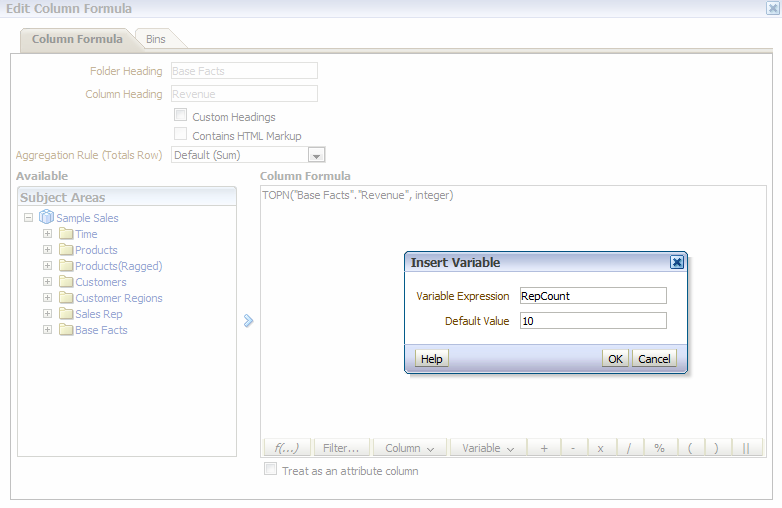
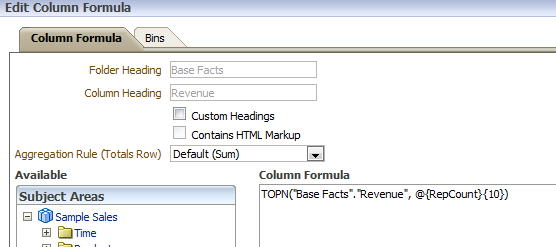
10. Then the “Column Formula” should contain the below formula as below:
11. TOPN(“Base Facts”.”Revenue”, @{RepCount}{10})
12. Select the option for the fourth “Revenue” column then select Sort -> “Sort Ascending”.
13. Now we go to to create two prompts for our analysis.
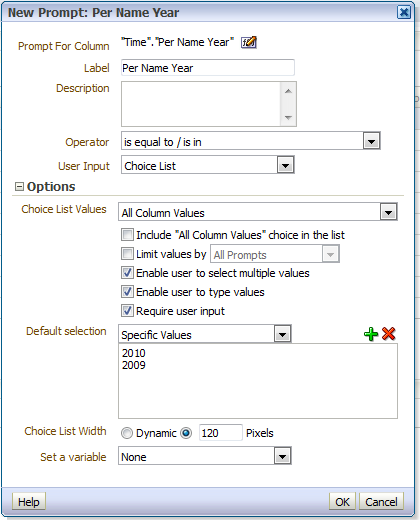
14. Select the “Prompts” tab and click on the ” + ” symbol to create a new prompt, select the “Column Prompt” -> “Time”.”Per New Year”.
15. Keep the default values and make sure these are checked: “Enable user to select multiple values”, “Enable user to type values”, “Require user input”.
16. For the “Default selection” select “Specific Values” and use the ” + ” icon to open the “Select Values” window.
17. In the “Select Value” window select 2010 and 2009 and move them to the “Selected” side and click the OK button.
Refer and make sure the values are correct as per below screenshot:
Create One More Prompt:
1. Add one more prompt by select the ” + ” icon on the “Definition” window.
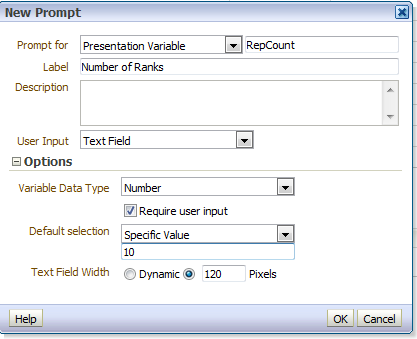
2. Select the “Variable Prompt”.
3. On the “New Prompt” window for “Prompt for” select “Presentation Variable” and on the side box enter “RepCount”.
4. for the “Label” enter “Number of Ranks”.
5. for the “User Input” select “Text Field”.
6. for the “Variable Data Type” select “Number”
7. check the “Require user input” checkbox.
8. for the “Default selection” select “Specific Value” and enter “10″.
9. then finally click the OK button.
make sure it is as below screenshot:
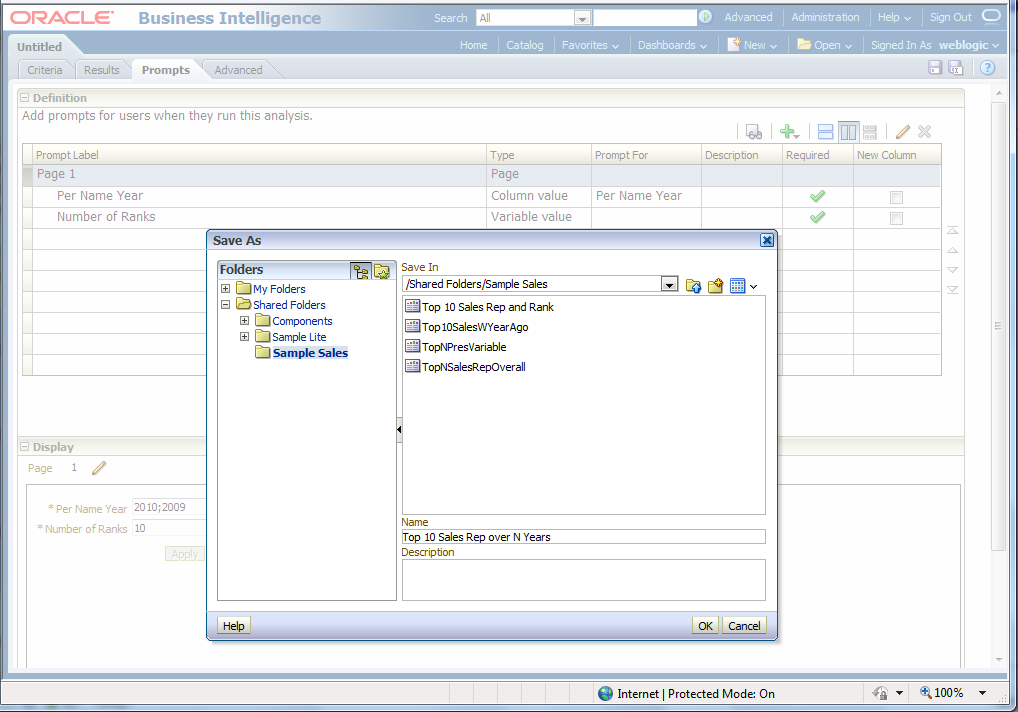
10. Once both prompts are created, click the “Save Analysis” icon and save your Analysis as “Top 10 Sales Rep over N Years”.
12. Select the “Results” tab and click on the “Show how results will look on a Dashboard” icon: to open a new windows with the newly created prompts:
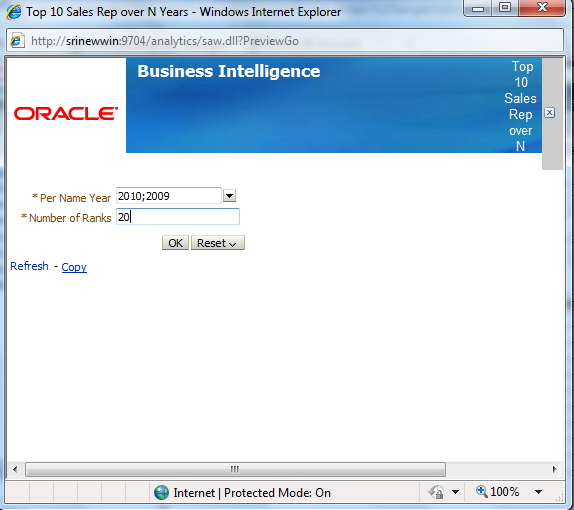
13. Keep the same values for “*Per Name Year” prompt i.e. 2010 and 2009.
14. Update the “*Number of Ranks” with 20 and then click the OK button to generate your report:
15. Now you can observe that “Larry Stephens” is only present in 2010 results and not in 2009 results.
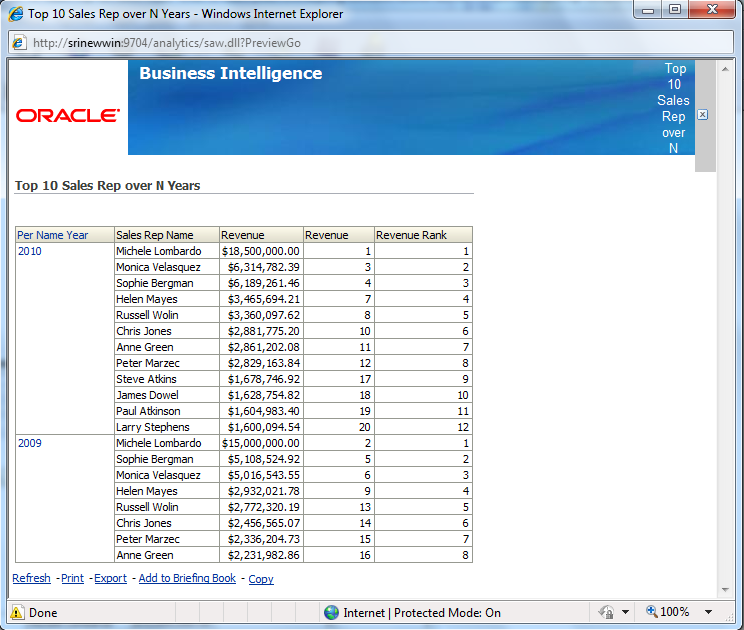
Finlay:
By creating both the column prompt and a variable prompt with “RepCount” we were able to view the top 20 Sales Reps Performers in over a 2 year period.
I will Discuss on the scenario like this
Present year is 2010 We Want display the Topn 10 Sales Every Year.Like 2010,2009 and 2008 also.
The below steps should be followed to achieve this.
1. Open the http://localhost:9704/analytics webpage and login.
2. Select the Home -> Analysis -> Sample Sales links to start creating a new analysis.
3. Select the five columns “Per Name Year”, “Sales Rep Name”, Revenue, Revenue, Revenue Rank as shown below:
4. Select the options for the “Per Name Year” Column then select Sort -> “Sort Descending” option.
5. Select the fourth Revenue column options then “Edit formula”.
6. In the “Edit Column Formula” window click the “f(…)” button to open the “Insert Function” window.
7. Select the Functions -> Aggregate -> TopN function and click OK button
8. Then click on the “Variable” button to open the “Insert Variable” window.
9. Enter “RepCount” for the “Variable Expression” and 10 for the “Default Value”, then click the OK button.
10. Then the “Column Formula” should contain the below formula as below:
11. TOPN(“Base Facts”.”Revenue”, @{RepCount}{10})
12. Select the option for the fourth “Revenue” column then select Sort -> “Sort Ascending”.
13. Now we go to to create two prompts for our analysis.
14. Select the “Prompts” tab and click on the ” + ” symbol to create a new prompt, select the “Column Prompt” -> “Time”.”Per New Year”.
15. Keep the default values and make sure these are checked: “Enable user to select multiple values”, “Enable user to type values”, “Require user input”.
16. For the “Default selection” select “Specific Values” and use the ” + ” icon to open the “Select Values” window.
17. In the “Select Value” window select 2010 and 2009 and move them to the “Selected” side and click the OK button.
Refer and make sure the values are correct as per below screenshot:
Create One More Prompt:
1. Add one more prompt by select the ” + ” icon on the “Definition” window.
2. Select the “Variable Prompt”.
3. On the “New Prompt” window for “Prompt for” select “Presentation Variable” and on the side box enter “RepCount”.
4. for the “Label” enter “Number of Ranks”.
5. for the “User Input” select “Text Field”.
6. for the “Variable Data Type” select “Number”
7. check the “Require user input” checkbox.
8. for the “Default selection” select “Specific Value” and enter “10″.
9. then finally click the OK button.
make sure it is as below screenshot:
10. Once both prompts are created, click the “Save Analysis” icon and save your Analysis as “Top 10 Sales Rep over N Years”.
12. Select the “Results” tab and click on the “Show how results will look on a Dashboard” icon:
to open a new windows with the newly created prompts: 13. Keep the same values for “*Per Name Year” prompt i.e. 2010 and 2009.
14. Update the “*Number of Ranks” with 20 and then click the OK button to generate your report:
15. Now you can observe that “Larry Stephens” is only present in 2010 results and not in 2009 results.
Finlay:
By creating both the column prompt and a variable prompt with “RepCount” we were able to view the top 20 Sales Reps Performers in over a 2 year period.
No comments:
Post a Comment